This is an old revision of the document!
The Mobile Dashboard
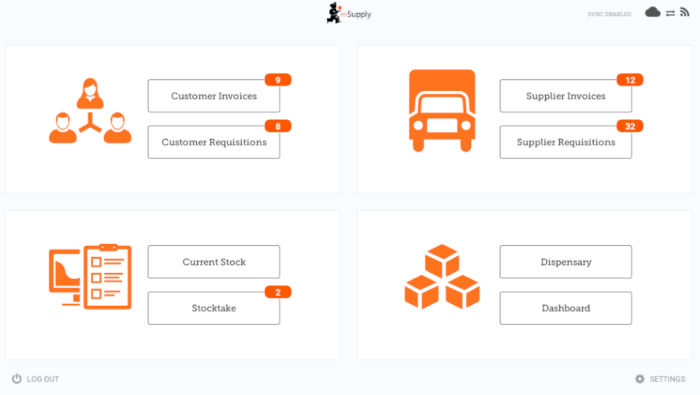
To access the Mobile Dashboard feature it will first need to be set up for your store by your management (see below for configuration details). Once it has been enabled you will be able to see the icon on the mSupply Mobile Menu page.

The Mobile Dashboard feature allows you to view visualisations (graphs) of the reports available.

Various reports are available for display in mobile. For example:
VEN items in stock
Shows stock on hand of each items that belongs to the VEN (Vital, Essential, Necessary) category
Items Issued This Month
Shows items issued by the facility within the last 30 days
Total stock value
A single figure in your default currency, showing the total value of the stock you have in the store you are viewing the dashboard for
This month's transactions
Shows a bar chart of the number of purchase orders, goods receipts, supplier and customer invoices created this month
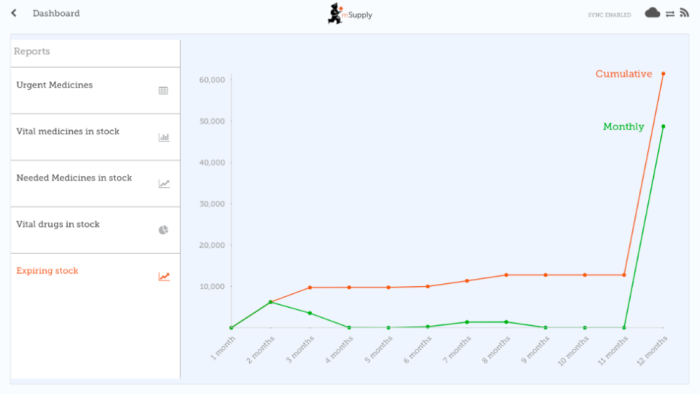
Expiring stock
Shows the cumulative and monthly number of all items expiring within the year, split into columns by month of expiry
Top facilities supplied
The 10 customers in your store to which you have sent the greatest value of stock in the past 90 days. Shows the value of stock for each customer
Transactions per store
Shows a table of all transactions per store within the past 7 and 30 days
Vital items in stock
Shows a bar graph of the percentage of medicines of the chosen category in stock at each facility
Sync sites last connection date
Shows the last connection date and current mSupply version of each sync site
Sync sites sent and received statistics
Shows number of records sent and received by each syc site within the last day
Trends in critical stock
Shows the historical stock on hand using parameters to filter store and/or items. Will show the current percentage, and percentages from the last day of each month for the prior six months.
Reports Monthly Transactions
Shows how many transactions of each type the chose store has processed this month
Stock each item in each store
Shows a table of items in rows and stores in columns, with the stock on hand for that item in that store in each cell.
Unfinalised Stock Transfers
Table of unfinalised stock transfers (between mSupply stores) for each facility
The list of reports can be found on the mSupply documentation site
mSupply Desktop Configuration
This section describes the configuration of reports on the mSupply central server, which will need to be done in order to have dashboard reports show on mSupply Mobile. The mSupply central server generates reports on a schedule, and if configured correctly, will generate versions for mobile sites which will be synced to mobile stores tablets. Here's how!
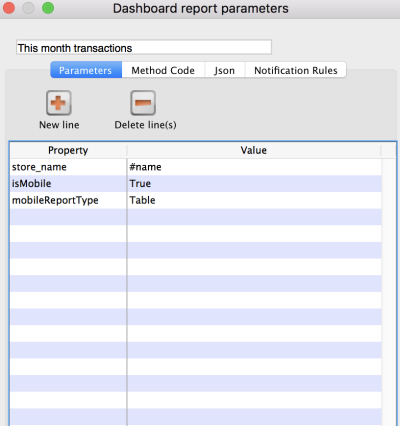
Dashboard reports need the following properties added to them in order for them to show in the mSupply mobile stores.
| Property | Values | Description |
|---|---|---|
| isMobile | True or False | The is the important one! Enable or disable sending this to your mobile sites |
| mobileReportType | table bar line or pie | The display type |
| [any property] | #[field on store table] | This is the tricky one! it allows you to replace properties with a value which is store specific. Use with care! For example, the property *store_name* can have a value of *#name*, in which case the *store_name* is replaced with the *name* of the store |
- Existing reports can be used and the properties currently configured are used to generate the information.
- Note that only mobile stores are sent the mobile dashboard data.
| Previous: Stocktakes (Program) | | Next: Indicators |

