Time range controls
The Time Range controls the data you can see at the Dashboard-level and at the Panel-level.
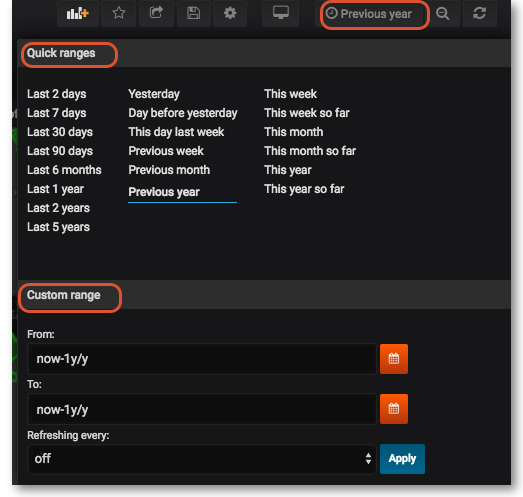
To view or change the Time Range, in the top right click on the Dashboard time picker (looks like a clock face). This shows the current dashboard time and refresh interval. It also acts as the menu button to toggle the time range controls.
Click here for more details on Grafana time range controls