mSupply Region Map
This is a custom panel which will need to be installed on your server. Contact mSupply support if this panel is not available to you.
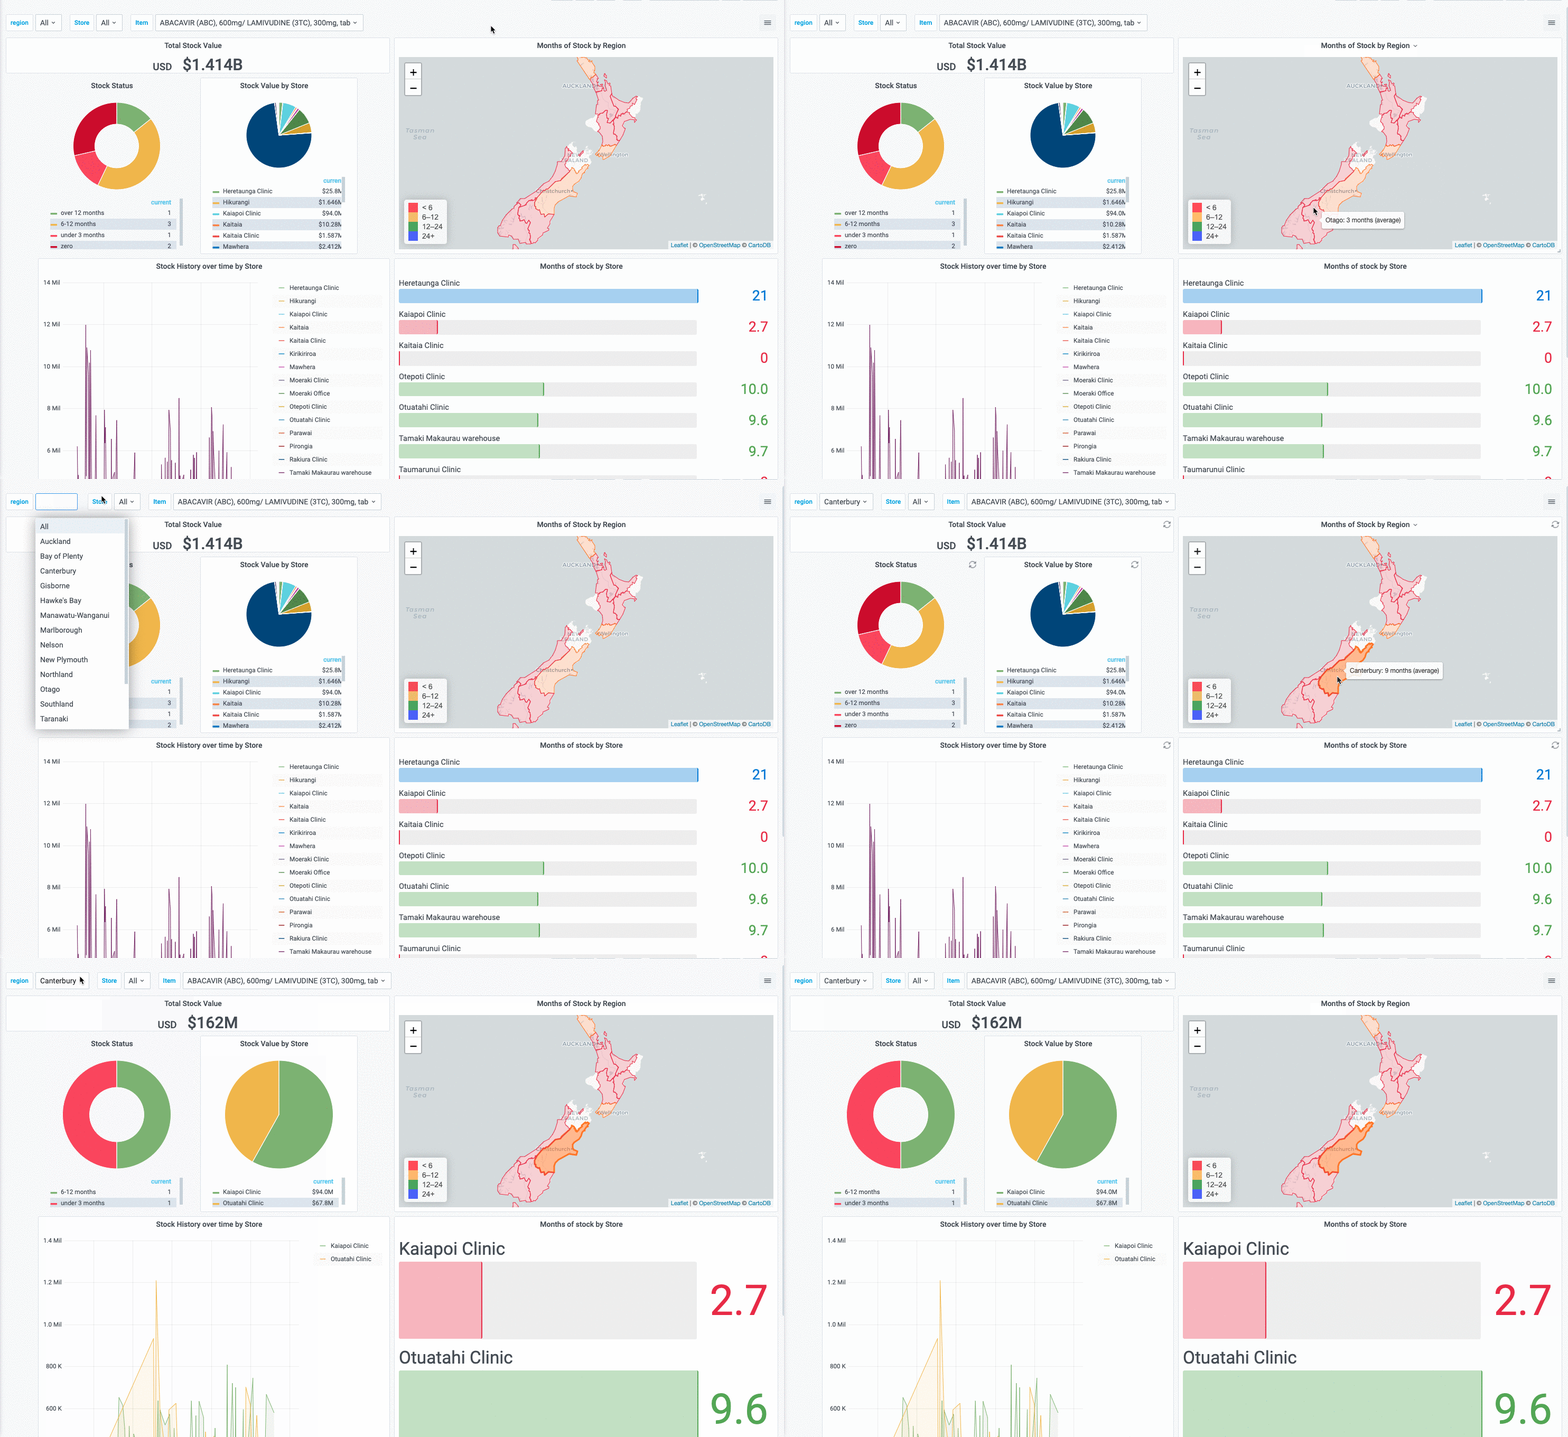
The region map displays a value and a geographic outline on a map, and allows you to set the colour thresholds for each region. This gives a quick visualisation of geographical data.
Additionally, you can define clickable actions to update filter values based on the region selected, as shown
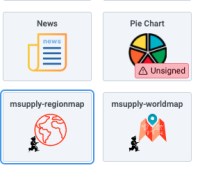
To use, select the msupply-regionmap visualisation option:
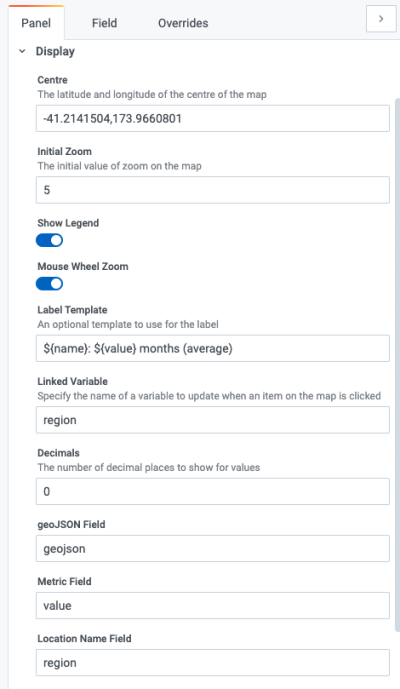
There are a number of options available in the Display section:
- Centre the latitude and longitude of the centre of the map
- Initial Zoom a numerical value for the initial zoom level of the map. Higher values are more zoomed in
- Show Legend toggles the display of a tooltip on mouse over
- Mouse Wheel Zoom toggles the ability to zoom the map using the mouse wheel
- Label template specifies a custom format for the tooltip. Use ${name} for the name field, ${value} for the numerical value and ${unit} for the unit field ( if used )
- Linked Variable Is where you can specify a linked filter - the variable with this name is updated when a region is clicked
- Decimals the number of decimals to truncate the display value to
- geoJSON Field specify the name of the field in your query which returns geoJSON data
- Metric Field specifies the name of the numerical value field
- Location Name Field specifies the name of the field containing a text value. Used in the tooltip / label as the name of the region


