This is an old revision of the document!
Panels
There are several different Panel types or visualizations you can have on your dashboard.
For instructions on how to configure each type of Panel click here:
- mSupply Region Map ( see below )
- mSupply Table ( see below )
- mSupply World Map ( see below )
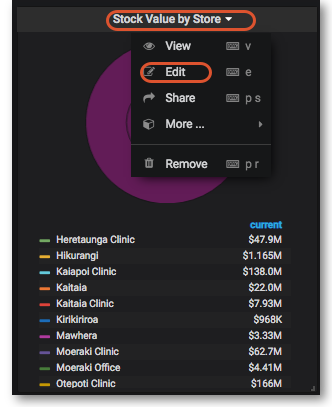
Clicking the title for a panel exposes a menu.
The Edit option opens additional configuration options for the panel.
mSupply Region Map
This is a custom panel which will need to be installed on your server. Contact mSupply support if this panel is not available to you.
The region map displays a value and a geographic outline on a map, and allows you to set the colour thresholds for each region. This gives a quick visualisation of geographical data.
Additionally, you can define clickable actions to update filter values based on the region selected, as shown

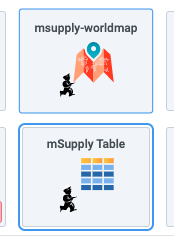
To use, select the msupply-regionmap visualisation option:

There are a number of options available in the Display section:

- Centre the latitude and longitude of the centre of the map
- Initial Zoom a numerical value for the initial zoom level of the map. Higher values are more zoomed in
- Show Legend toggles the display of a tooltip on mouse over
- Mouse Wheel Zoom toggles the ability to zoom the map using the mouse wheel
- Label template specifies a custom format for the tooltip. Use ${name} for the name field, ${value} for the numerical value and ${unit} for the unit field ( if used )
- Linked Variable Is where you can specify a linked filter - the variable with this name is updated when a region is clicked
- Decimals the number of decimals to truncate the display value to
- geoJSON Field specify the name of the field in your query which returns geoJSON data
- Metric Field specifies the name of the numerical value field
- Location Name Field specifies the name of the field containing a text value. Used in the tooltip / label as the name of the region
mSupply Table
This is a custom panel which will need to be installed on your server. Contact mSupply support if this panel is not available to you. The mSupply table is an extension of the bundled Table plugin, which adds * clickable actions to cells which update filter values * a button which allows exporting the data direct to excel (requires the msupply-dashboard-app plugin also )
Be aware that it also removes the Filter functionality of the bundled table plugin.
To use, select the msupply-table visualisation option:
mSupply World Map
| Previous: Getting Started | | Next: Time range controls |