# Getting Started
### Introduction
#### Grafana
Your mSupply Dashboard uses [Grafana](https://grafana.com/products/cloud/features/#cloud-dashboards-grafana), an open source visualisation tool that is linked to your mSupply data. This User Guide contains external links to Grafana information pages to explain various concepts and how to edit your current dashboard and create new dashboards.
#### Dashboards and Panels
Each Dashboard is composed of editable **Panels** arranged on a grid. The panels are separated by rows and can be dragged-and-dropped to a different location on the grid. Each panel queries your mSupply data to give you information in a visual form (graph, table etc).
#### Store login permissions to determine data visibility
The dashboards can be configured such that data visibility is controlled according to the store login permissions of the user. This can be an efficient way of managing dashboards. Instead of having a large range of very similar dashboards where the only difference between them is the user / store who's data is visible, you can have just one dashboard, where different users will see data according to the stores which they have permission to log in to.
#### Flexibility
You can view and share data from your dashboard, change the appearance and type of data the panels in your dashboard show, and create new dashboards customised to suit your needs.
For a detailed overview refer to [Grafana Dashboard Concepts](http://docs.grafana.org/guides/getting_started/#basic-concepts)
----
### Setting up Users
#### Setting up users under Grafana
It is possible to set up users under Grafana. Grafana has documentation for this and will not be detailed here. As dashboard access is likely highly correlated with store access within mSupply, it is not recommended to use this method, but to set up users from within mSupply.
#### Setting up users from within mSupply
You can login to the dashboard using your current mSupply login. An account is created for you automatically in the grafana system with standard viewer-level permissions.
If you are to have a Grafana editor or administrator role, then Sustainable Solutions, or another Grafana administrative user, can set that up for you in Grafana after you have logged in for the first time.
To use the dashboard, an mSupply user must be configured to:
* **Use the Dashboard**.[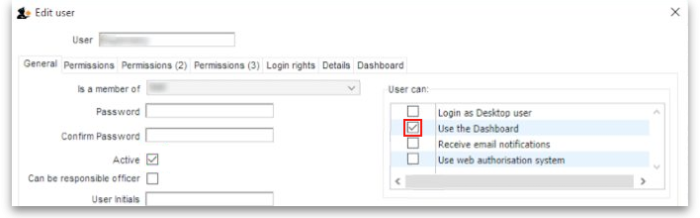 ](/_detail/en:dashboard:pasted:20210118-053554.png?id=en%3Adashboard%3Agetting_started)
* Have **Active** status enabled.[
](/_detail/en:dashboard:pasted:20210118-053554.png?id=en%3Adashboard%3Agetting_started)
* Have **Active** status enabled.[ ](/_detail/en:dashboard:active_user_censored.png?id=en%3Adashboard%3Agetting_started)
* Enter an email address for the user.[
](/_detail/en:dashboard:active_user_censored.png?id=en%3Adashboard%3Agetting_started)
* Enter an email address for the user.[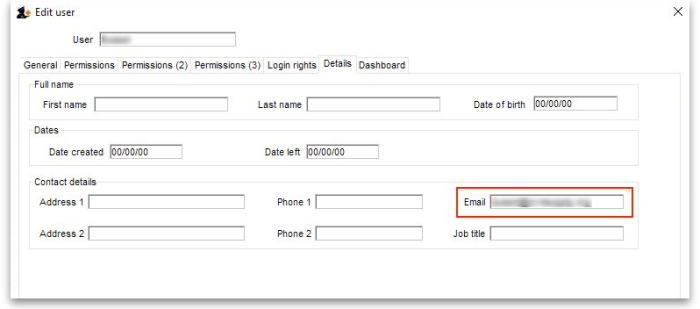 ](/_detail/en:dashboard:email_user_entered_censored.png?id=en%3Adashboard%3Agetting_started)
#### Data permissions governed by user store login permission
It is recommended to configure dashboard such that the data visible is filtered according to the user's permission to log in to the store. In this case, you will need to do some more configuration of the user in mSupply:
* Configure the user to be able to log in to the stores for which you want them to have access.[
](/_detail/en:dashboard:email_user_entered_censored.png?id=en%3Adashboard%3Agetting_started)
#### Data permissions governed by user store login permission
It is recommended to configure dashboard such that the data visible is filtered according to the user's permission to log in to the store. In this case, you will need to do some more configuration of the user in mSupply:
* Configure the user to be able to log in to the stores for which you want them to have access.[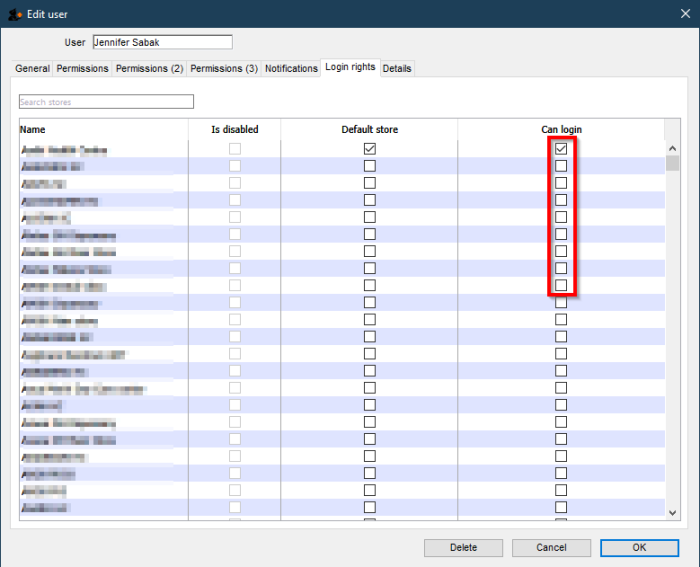 ](/_detail/en:dashboard:pasted:20220516-235034.png?id=en%3Adashboard%3Agetting_started)
Other than these, no other special configuration of the mSupply user account is required - including any permissions in any of the stores.
Valid Grafana user names are more restrictive than mSupply. For example, if the mSupply user name contains a hyphen (`-`) then Grafana will not accept that user name.
* `John Doe` is valid
* `John-Doe` is not valid
Users may need to have their mSupply username, which *was* working perfectly, amended in order for them to be able to log in to the Dashboard.
### Logging In
Users log in by entering the URL address of dashboard on a web browser.
The oauth (mSupply login) app requires something that Internet Explorer doesn't support. You must use another browser to log in to the mSupply dashboards.
Also, just STOP USING Internet Explorer - [it's dangerous](https://mashable.com/article/internet-explorer-vulnerability-just-stop-using-it/)!
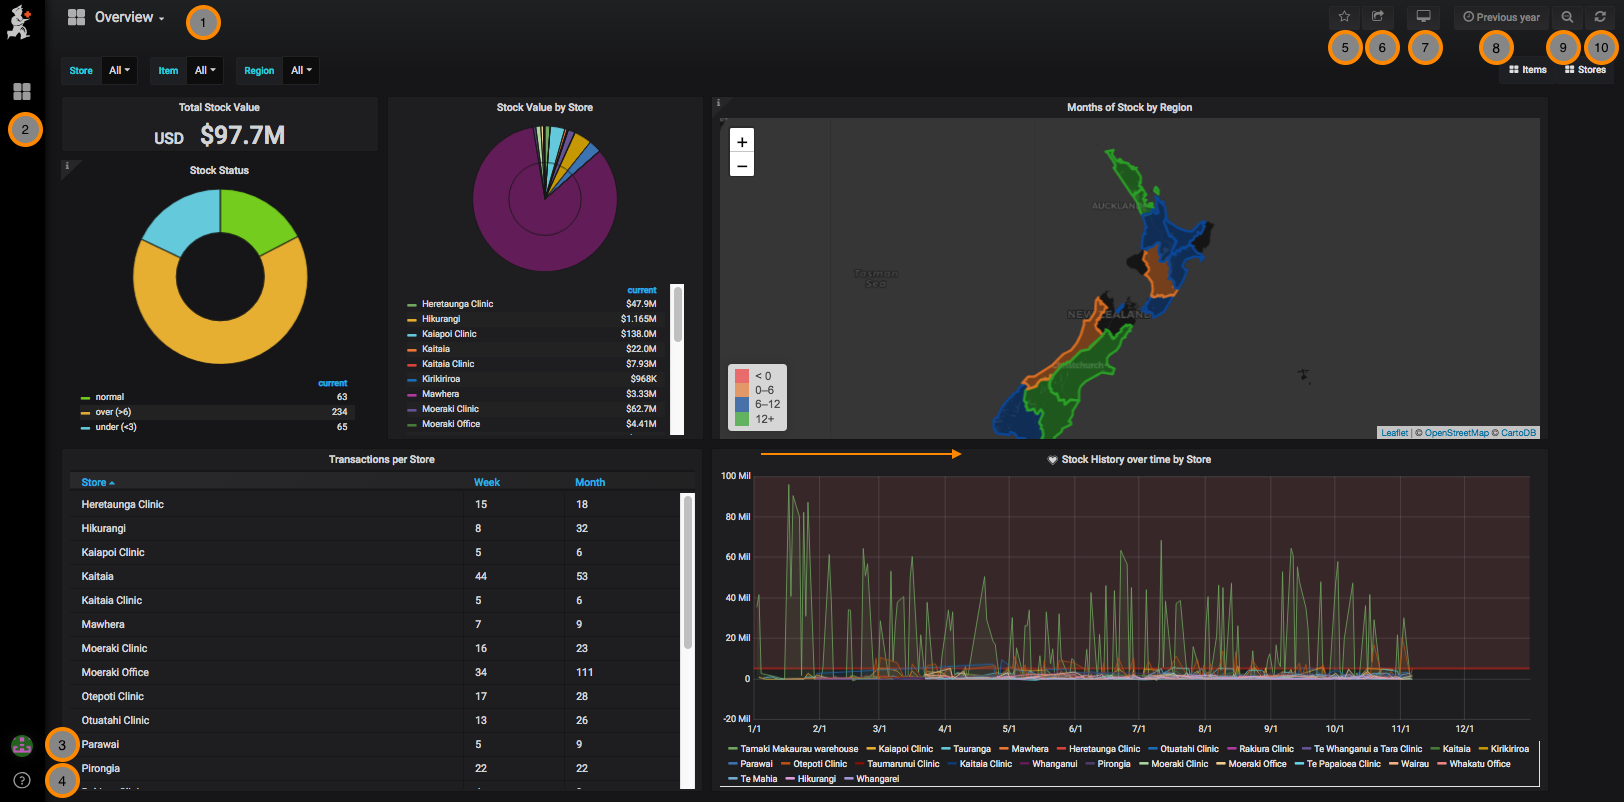
When you log in you may see a suite of dashboards similar to the example below.
This example is showing the 'Overview' Dashboard.
It is set to a Time Range of 'Previous year'
This Dashboard example contains six Panels:
* Total stock value
* Stock status
* Stock value by store
* Transactions per store
* Months of stock by region
* Stock history over time by store
[
](/_detail/en:dashboard:pasted:20220516-235034.png?id=en%3Adashboard%3Agetting_started)
Other than these, no other special configuration of the mSupply user account is required - including any permissions in any of the stores.
Valid Grafana user names are more restrictive than mSupply. For example, if the mSupply user name contains a hyphen (`-`) then Grafana will not accept that user name.
* `John Doe` is valid
* `John-Doe` is not valid
Users may need to have their mSupply username, which *was* working perfectly, amended in order for them to be able to log in to the Dashboard.
### Logging In
Users log in by entering the URL address of dashboard on a web browser.
The oauth (mSupply login) app requires something that Internet Explorer doesn't support. You must use another browser to log in to the mSupply dashboards.
Also, just STOP USING Internet Explorer - [it's dangerous](https://mashable.com/article/internet-explorer-vulnerability-just-stop-using-it/)!
When you log in you may see a suite of dashboards similar to the example below.
This example is showing the 'Overview' Dashboard.
It is set to a Time Range of 'Previous year'
This Dashboard example contains six Panels:
* Total stock value
* Stock status
* Stock value by store
* Transactions per store
* Months of stock by region
* Stock history over time by store
[ ](/_detail/dashboard:dashboard1.png?id=en%3Adashboard%3Agetting_started)
### Let's walk through the navigation menus
[
](/_detail/dashboard:dashboard1.png?id=en%3Adashboard%3Agetting_started)
### Let's walk through the navigation menus
[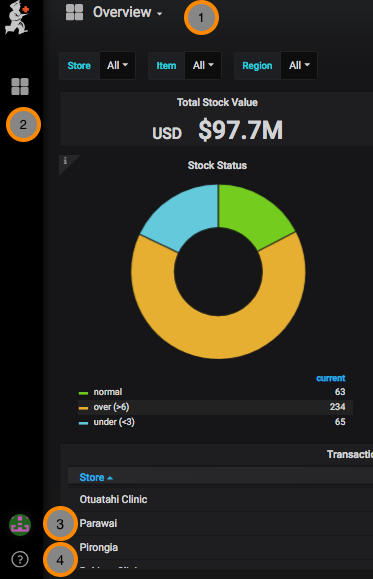 ](/_detail/dashboard:dashboard1a.png?id=en%3Adashboard%3Agetting_started)
**1. Overview** - This is the dashboard you are viewing. Clicking on this opens a window to view your other dashboards.
**2. Dashboards** menu - Home, Manage dashboards, Playlists, Snapshots
**3. User** menu - Preferences, change password, sign out
**4. Help** menu - Keyboard shortcuts, Community site, Grafana documentation
[
](/_detail/dashboard:dashboard1a.png?id=en%3Adashboard%3Agetting_started)
**1. Overview** - This is the dashboard you are viewing. Clicking on this opens a window to view your other dashboards.
**2. Dashboards** menu - Home, Manage dashboards, Playlists, Snapshots
**3. User** menu - Preferences, change password, sign out
**4. Help** menu - Keyboard shortcuts, Community site, Grafana documentation
[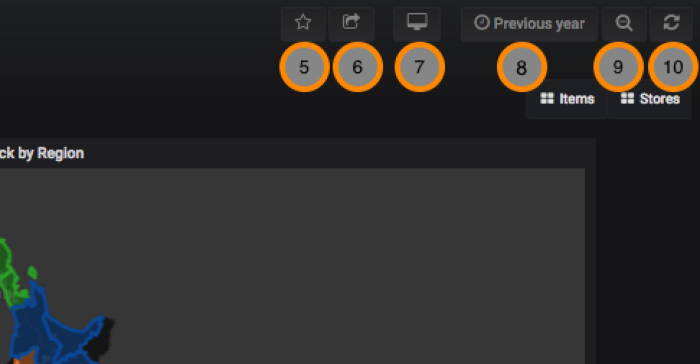 ](/_detail/en:dashboard:dashboard1b.png?id=en%3Adashboard%3Agetting_started)
**5. Mark as Favourite**
**6. Share Dashboard** - [via snapshot or link](/en:dashboard:sharing)
**7. Cycle View Mode**
**8. Time Range** - [control the time period for your dashboard](/en:dashboard:time_range)
**9. Search**
**10. Refresh**
| * Previous: **[mSupply Grafana web dashboard](/en:dashboard)** | | Next: **[Panels](/en:dashboard:panels)** * |
](/_detail/en:dashboard:dashboard1b.png?id=en%3Adashboard%3Agetting_started)
**5. Mark as Favourite**
**6. Share Dashboard** - [via snapshot or link](/en:dashboard:sharing)
**7. Cycle View Mode**
**8. Time Range** - [control the time period for your dashboard](/en:dashboard:time_range)
**9. Search**
**10. Refresh**
| * Previous: **[mSupply Grafana web dashboard](/en:dashboard)** | | Next: **[Panels](/en:dashboard:panels)** * |